Monitoring daily operational data is one of the most effective ways to ensure long-term stability of LiFePO₄ energy storage batteries. By understanding trends in voltage, SOC, current, temperature, and internal resistance, users can detect abnormalities early and prevent system downtime, capacity loss, or BMS malfunction.
This article provides a detailed guide to daily monitoring and data management for residential, commercial, and industrial ESS.
1. Key Battery Parameters to Monitor Daily
To maintain optimal performance, the following core parameters must be checked regularly:
(1) Battery State of Charge (SOC)
- Ensure SOC stays between 20%–90% for daily cycling.
- SOC that fluctuates abnormally may indicate:
- Faulty inverter settings
- Incorrect BMS calibration
- Weak or aging cells
- Poor communication protocols
(2) Voltage and Cell Balance
- Total pack voltage should remain stable during regular charge/discharge.
- Cell voltage deviation should be less than 0.03–0.05V.
- A large deviation may require:
- Manual balancing
- Firmware update
- Aging diagnostics
(3) Current Levels (Charge/Discharge)
Monitor:
- Peak charge current
- Peak discharge current
- Continuous current
- Overcurrent warnings
High currents generate heat and reduce lifespan.
(4) Temperature Range
Ideal operating temperature: 10°C – 35°C
If temperature exceeds 45°C, battery stress increases rapidly.
(5) BMS Error Codes
Common daily warnings include:
- High temperature
- Low temperature charging block
- Cell over-voltage
- Cell under-voltage
- Communication error (CAN/RS485)
2. Tools Used for Daily Monitoring
✔ Mobile Apps Provided by Manufacturers
Best for residential and small commercial ESS.
Allows real-time viewing of:
- Voltage
- SOC
- Capacity
- Temperature
- Daily logs
✔ Inverter Monitoring Platforms
Brands like:
- Growatt
- Deye
- Victron
- GoodWe
- Luxpower
Provide cloud-based monitoring and automatic alerts.
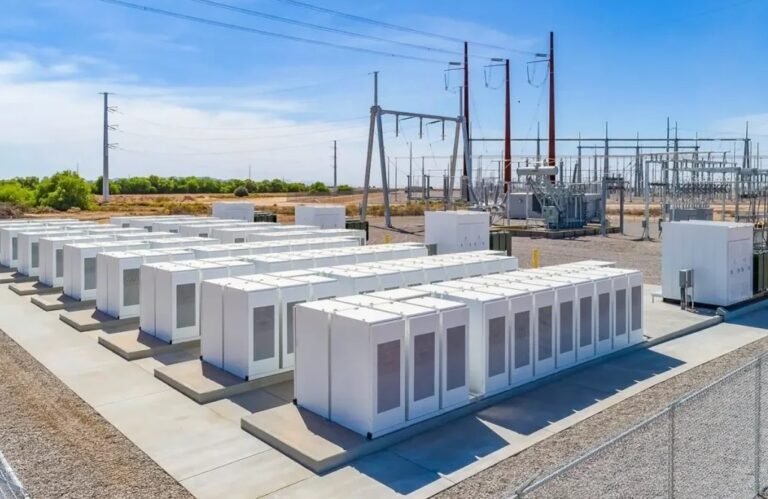
✔ Industrial EMS (Energy Management System)
For large-scale systems:
- Tracks performance
- Predicts degradation
- Optimizes energy usage
- Provides efficiency reports
3. Recording and Analyzing Data Trends
Daily Data to Record
- SOC morning/evening
- PV generation
- Load consumption
- Charge/discharge kWh
- Temperature range
- Warning logs
Why Record Data?
- Helps identify battery decline
- Facilitates warranty claims
- Assists in optimizing solar usage
- Predicts maintenance needs
Data Trend Interpretation
- Rising minimum SOC → insufficient PV or oversized load
- Increasing temperature curve → ventilation issues
- Shortened discharge time → possible capacity decay
- More balancing events → cell drift beginning
4. Identifying Abnormal Behavior Early
Abnormal patterns include:
- Unexpected shutdown
- Sudden voltage drop under low load
- Rising internal resistance
- Gradual SOC calibration drift
- Frequent BMS alarms
Immediate inspection is required to avoid further damage.
SEO Keywords
LiFePO4 data monitoring, lithium battery performance analysis, ESS daily monitoring, solar battery data log, LFP battery health tracking, battery parameter interpretation