
Introduction
A customer owns a 10kWh LiFePO4 battery. The battery has delivered approximately 8kWh of energy. The customer expects the grid to use exactly 8kWh to recharge it. Instead, the electricity meter shows a higher number.
The immediate question is:
“Where did the extra electricity go?”
This is normal. No real energy storage system is 100% efficient.
Between electricity entering from:
- Solar panels
- Utility grid
- Generator
and finally becoming stored chemical energy inside the battery, several conversion stages consume energy.
Understanding these losses is important when calculating:
- Charging cost
- Solar system size
- Generator fuel use
- Daily operating efficiency
- Commercial ESS payback
Battery Capacity Is Not the Same as Input Energy
Consider a nominal:
51.2V 200Ah LiFePO4 battery
Its nominal energy is:
51.2V × 200Ah = 10.24kWh
This does not mean exactly 10.24kWh measured at the AC meter will move the battery from empty to full.
Why?
Because the electricity must pass through other equipment before reaching the cells.
Typical losses occur in:
- AC/DC conversion
- DC/DC conversion
- Battery internal resistance
- Cables
- Busbars
- BMS electronics
- Inverter standby consumption
Therefore:
AC energy consumed ≠ DC energy stored
Start with the Charging Path
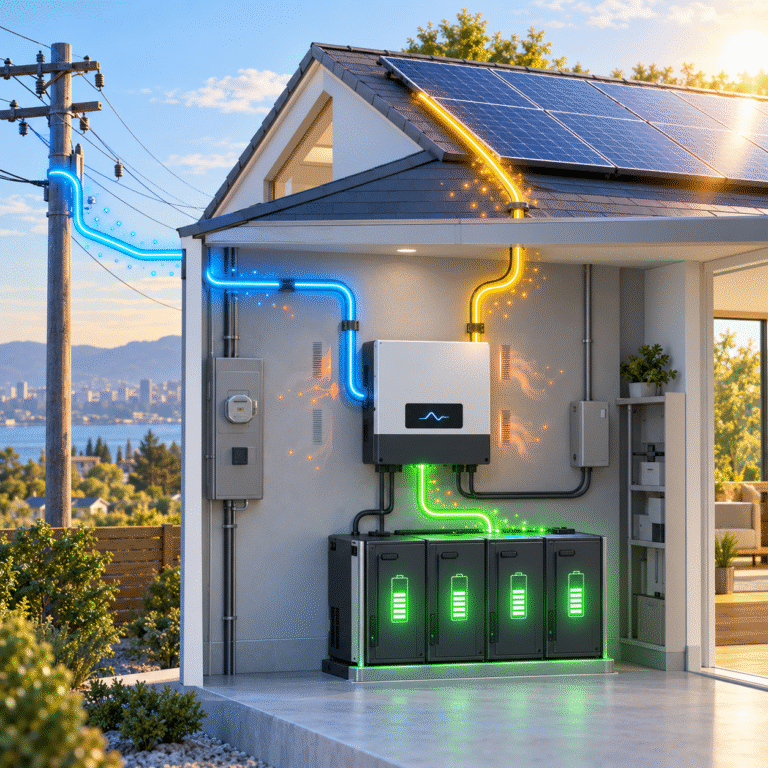
When charging from the grid, the path may be:
Grid AC → inverter charger → DC bus → battery → electrochemical storage
When charging from solar, it may be:
PV DC → MPPT → DC bus → battery
or:
PV DC → solar inverter → AC → battery inverter → DC → battery
The more conversion stages electricity passes through, the more opportunities there are for losses.
Loss 1: Inverter/Charger Conversion
An inverter charger must convert AC electricity into DC electricity.
This conversion is efficient but not perfect.
Part of the energy becomes heat inside:
- Power transistors
- Inductors
- Transformers where used
- Control electronics
Conversion efficiency also changes according to operating power.
An inverter charger may operate very efficiently near its optimal load but less efficiently at extremely low charging power.
Therefore, charging a large battery very slowly is not always the most energy-efficient operating point.
Loss 2: Battery Internal Resistance
LiFePO4 cells have low internal resistance, which is one of their advantages.
However, resistance is never zero.
During charging:
Heat loss ≈ Current² × Resistance
This means charging losses rise as current increases.
If current doubles, resistive heating can increase significantly.
This is one reason extremely high charging currents are not automatically the most efficient option.
Moderate charging rates often provide a good balance between:
- Charging speed
- Heat
- Efficiency
- Equipment stress
Loss 3: Battery Cables and Busbars
DC battery systems can carry high current.
For example, 5kW of charging power into a 51.2V battery can involve around 100A of DC current depending on actual charging voltage and system conditions.
If battery cables are:
- Too small
- Too long
- Poorly terminated
they create additional resistance.
The result is:
- Voltage drop
- Heat
- Energy loss
For large systems, busbar and cable design directly affects efficiency.
Loss 4: BMS and Control Electronics
A modern LiFePO4 battery contains electronics that consume power.
These may include:
- BMS
- Display
- Communication module
- Contactor
- Bluetooth module
- Wi-Fi module
- Heating system
- Cooling system
Their consumption is usually small compared with the total battery capacity, but over long periods it contributes to system energy use.
Large battery cabinets may also contain:
- Fans
- HVAC
- Fire protection controls
- Monitoring equipment
These auxiliary loads must be considered in commercial ESS efficiency calculations.
Loss 5: Inverter Standby Consumption
A hybrid inverter uses energy even when it is not delivering significant load power.
It needs electricity for:
- Processor
- Display
- Relays
- Communications
- Cooling fans
- Grid synchronization
- MPPT operation
For a large commercial system, this may be a relatively small percentage.
For a small residential battery operating at light load for many hours, standby energy can become more noticeable.
Why AC Meter Readings and BMS Readings Do Not Match
Customers sometimes compare:
Electricity meter kWh
with
BMS battery kWh
and expect identical numbers.
They measure different points in the energy chain.
The AC meter measures electricity entering the system.
The BMS estimates or measures energy at the battery side.
Between those points are:
- Conversion losses
- Auxiliary consumption
- Active household loads
Therefore, a difference is expected.
Household Loads Can Create a Large Measurement Error
Consider this example.
During two hours of grid charging:
- Grid meter shows 8kWh consumed.
- Customer believes all 8kWh went into the battery.
But during the same period the house consumed:
- Air conditioner: 1.8kWh
- Refrigerator: 0.3kWh
- Lighting: 0.2kWh
- Other loads: 0.7kWh
Total household consumption: 3kWh
Only part of the 8kWh was available for battery charging.
This is one of the most common reasons users believe a battery has poor charging efficiency.
Always Measure Net Battery Power
For an accurate charging-efficiency test, monitor:
- AC input energy
- Active load energy
- Battery charging energy
- Starting SOC
- Ending SOC
The test should ideally be performed under controlled conditions.
Otherwise, background household consumption can distort the result.
Example: Charging a 10.24kWh Battery
Suppose a 10.24kWh battery moves from:
20% SOC → 90% SOC
SOC increase: 70%
Approximate nominal energy added:
10.24 × 70% = 7.17kWh
The grid may need to provide more than 7.17kWh because of:
- Inverter losses
- Battery losses
- Cable losses
- Standby consumption
If loads operate at the same time, total grid consumption can be considerably higher.
This does not mean the battery has lost several kilowatt-hours internally.
The complete system must be evaluated.
Charge Efficiency vs Round-Trip Efficiency
These two terms should not be confused.
Charging Efficiency
This compares energy reaching the battery with energy used to charge it.
Round-Trip Efficiency
This compares useful energy recovered later with the energy originally used to charge the storage system.
Round-trip efficiency includes both:
charging + storage + discharging + conversion
For example:
AC electricity charges the battery.
Then the battery later supplies an AC appliance.
The energy may pass through:
AC → DC → battery → DC → AC
Each stage creates some loss.
Round-trip efficiency is therefore lower than the efficiency of a single conversion stage.
Why High Charging Current Creates More Heat
Electrical resistance causes losses proportional to current squared.
This is especially important in low-voltage, high-current battery systems.
Imagine two charging strategies delivering similar total energy.
Strategy A
High current for a short period.
Strategy B
Moderate current over a longer period.
Strategy A may create more:
- Cable heating
- Terminal heating
- Cell heating
However, charging too slowly also keeps inverters and auxiliary systems operating longer.
Therefore, the most efficient charging rate is not necessarily the lowest possible current.
It should be selected according to the complete system.
Why 48V Systems Are Popular
Higher battery voltage reduces current for the same power.
For example:
At approximately 5kW:
A 12V-class battery system may require several hundred amps.
A 48V/51.2V system requires much less current.
Lower current can reduce:
- Cable size
- Resistive losses
- Voltage drop
- Terminal heating
This is one reason 48V and 51.2V LiFePO4 systems are widely used in residential energy storage.
Larger Commercial Systems Use Even Higher Voltages
As ESS power increases, DC current becomes a major design issue.
Commercial systems may use high-voltage battery stacks instead of 48V architectures.
For example, transmitting:
100kW
at low battery voltage would require extremely high current.
A higher-voltage battery system can deliver the same power using much lower current.
This can improve:
- System efficiency
- Cable practicality
- Busbar design
- Power conversion
That is why large commercial ESS architectures differ substantially from small residential systems.
Solar Charging Has Additional Variables
When solar panels charge a battery, losses do not begin at the battery.
Energy can also be lost due to:
- Panel temperature
- Shading
- Dirt
- Cable voltage drop
- MPPT conversion
- Inverter conversion
- Clipping
- Curtailment
Therefore, if a 10kW PV array does not provide 10kW of battery charging, this is completely normal.
Some PV power may also be supplying active loads.
Example: 8kW Solar Production
Suppose the PV system generates: 8kW
At the same time:
House load = 3kW
Inverter/MPPT and other system losses consume part of the remaining energy.
Battery charging power may therefore be below: 5kW
This is not evidence of battery inefficiency.
The battery only receives the energy remaining after other system demands.
Does Charging at 100% SOC Waste Energy?
When the battery approaches its charging limit, the BMS or inverter may reduce charging current.
The system may enter:
- Constant-voltage operation
- Charge-current reduction
- Cell balancing
If solar power remains available, the excess energy must be:
- Used by loads
- Exported
- Curtailed
depending on system architecture.
Energy that the battery cannot accept is not necessarily lost inside the battery.
Often, it was never sent to the battery.
Battery Heating Can Change the Calculation
In cold climates, a self-heating LiFePO4 battery may use part of incoming power to warm the cells before charging.
For example:
Solar or grid power arrives.
The battery is too cold.
Power is diverted to the heater.
Only after the cell temperature rises does normal charging begin.
A customer may see:
- Electricity consumption
- Little SOC increase
during the heating period.
This is normal for a self-heating system.
Cooling Loads Matter in Hot Commercial ESS
Large battery cabinets installed in hot climates may require:
- Air-conditioning
- Fans
- Liquid cooling
Cooling energy does not increase battery SOC.
However, it is still part of the energy storage system’s operating consumption.
When calculating commercial ESS economics, auxiliary energy should be included.
How to Perform a Practical Efficiency Test
A useful test procedure is:
Step 1
Record battery SOC and battery energy.
Step 2
Minimize unnecessary loads.
Step 3
Start charging at a stable power level.
Step 4
Record AC input energy.
Step 5
Record battery-side charged energy.
Step 6
Stop at the defined target SOC.
Step 7
Compare the readings.
Repeat the test more than once if possible.
One single charge session can be influenced by:
- BMS calibration
- Cell balancing
- temperature
- load variations
Do Not Calculate Efficiency Only from SOC
Suppose SOC changes from:
30% → 80%
It may be tempting to say exactly 50% of battery capacity was added.
But SOC is an estimate.
BMS algorithms may recalculate SOC during charging.
Therefore, professional testing should use:
- Energy counters
- Current integration
- Voltage/current logging
in addition to displayed SOC.
Why This Matters for Commercial Projects
Charging losses directly affect project economics.
Consider a commercial ESS that moves hundreds of kilowatt-hours every day.
Even a small difference in system efficiency can become significant over:
- 365 days
- Thousands of cycles
- Many years
Therefore, project designers should evaluate:
- PCS efficiency
- Battery efficiency
- HVAC consumption
- Cable losses
- Transformer losses
- Standby consumption
not only battery purchase price.
Information B2B Buyers Should Request
For large LiFePO4 systems, ask suppliers for:
- Battery nominal energy
- Usable energy
- Recommended charge current
- Maximum charge current
- PCS efficiency
- Standby consumption
- BMS consumption
- Thermal-management power
- Operating temperature range
This information makes project calculations more realistic.
Conclusion
If a battery stores 10kWh, it does not mean exactly 10kWh from the electricity meter will produce 10kWh of usable stored energy.
Energy is consumed throughout the complete charging system.
Typical losses occur in:
- Inverter chargers
- DC converters
- Battery cells
- Cables
- BMS electronics
- Auxiliary equipment
At the same time, active loads can make the difference between grid input energy and battery-stored energy appear much larger.
For accurate evaluation, measure the entire energy flow rather than comparing only meter consumption with battery SOC.
HIZN provides LiFePO4 energy storage batteries for residential, commercial, telecom and off-grid systems, including low-voltage and high-capacity storage configurations.
For an ESS project, send us your battery capacity, inverter model, charging source and required charging time. We can help evaluate the battery-side charging requirements and overall energy flow.