
Introduction
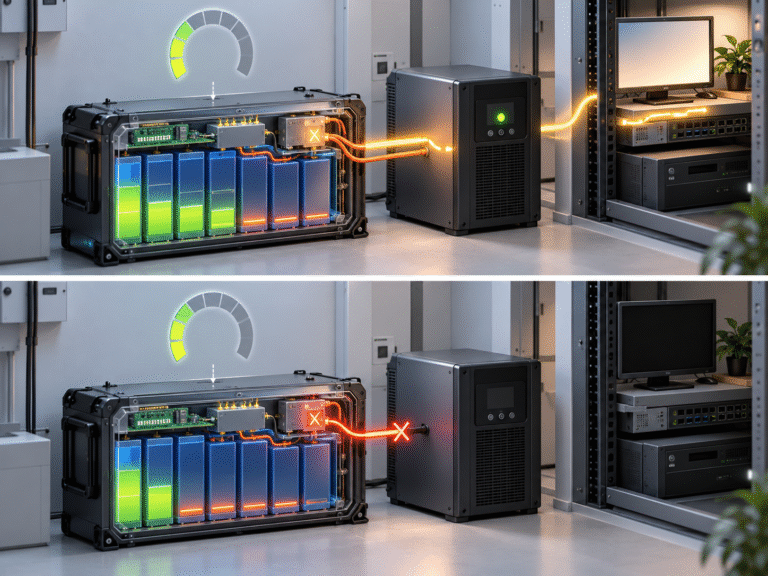
A UPS is operating normally from a LiFePO4 battery. The battery management system shows 45% SOC, then 40%, then perhaps 37%. The customer expects plenty of backup time to remain.
A few minutes later, the display suddenly changes to: 0% SOC and the UPS shuts down.
The customer naturally asks: “How can 37% of the battery disappear in a few minutes?”
In most cases, the energy did not physically disappear. What changed suddenly was the BMS estimate of remaining SOC or the battery reached an electrical condition where it could no longer continue discharging safely.
This distinction matters because a sudden SOC drop can come from several very different causes. The battery may only need SOC recalibration, or one cell may be reaching low-voltage protection earlier than the others. A heavy UPS load can also push cell voltage below the BMS threshold even when the pack still appears to have substantial SOC.
For UPS dealers and battery distributors, the correct diagnosis requires looking beyond the percentage on the screen.
SOC Is an Estimate, Not a Direct Measurement of Stored Energy
A battery does not contain a physical sensor that directly measures “37% remaining.” The BMS estimates SOC using information such as current entering and leaving the battery, cell voltage, charging history and internal software algorithms.
A common method is coulomb counting. If 50Ah leaves a fully charged 100Ah battery, the BMS can estimate that roughly half the charge remains. This sounds simple, but every current measurement has a small amount of error. Over many partial charging and discharging cycles, those errors can accumulate. Eventually, displayed SOC can drift away from the battery’s actual electrochemical state.
Why LiFePO4 Makes SOC Estimation More Difficult
LiFePO4 has a relatively flat voltage curve through much of its operating range. A lead-acid battery’s voltage often changes more visibly as SOC decreases. LiFePO4 can maintain a relatively stable voltage for a large portion of the discharge cycle. That makes it difficult for the BMS to use voltage alone to correct SOC in the middle of the range.
The BMS may therefore continue showing 40% or 30% because its coulomb-counting estimate says energy remains. Once the battery reaches the lower voltage knee, cell voltage changes more quickly. The BMS suddenly receives strong evidence that the battery is much closer to empty than previously estimated. It then corrects the displayed SOC.
The customer sees: 37% → 0%
but the real event is: incorrect SOC estimate → rapid recalibration near the lower endpoint.
Long Periods of Partial Cycling Can Increase SOC Drift
Consider a UPS battery that normally operates between 40% and 85%. The battery never reaches the BMS’s recognized full-charge condition and rarely reaches a controlled low-SOC reference point. After many weeks or months, the displayed SOC can gradually drift.
The battery may show 80% when the actual available energy corresponds to a lower SOC. This does not necessarily mean the cells have lost the same percentage of capacity. The BMS simply needs better reference information. However, any recalibration procedure should follow the battery manufacturer’s instructions. Repeated deep discharge is not a good general maintenance method for LiFePO4 batteries.
A Weak Cell Can Create the Same Symptom for a More Serious Reason
SOC drift is only one possibility. A 51.2V LiFePO4 battery commonly contains 16 series cell groups. Because they are connected in series, the same discharge current passes through every group. Suppose 15 cells still have reasonable remaining capacity but one cell has lower usable capacity.
As the battery discharges, that weak cell reaches its lower voltage limit first. The BMS must protect the entire battery when that one cell reaches the undervoltage threshold. The battery therefore stops even though other cells still contain energy. The BMS display may still have shown 30–40% shortly before shutdown because its pack-level SOC estimate did not fully reflect the weak-cell condition.
Cell Voltage Is More Important Than Pack SOC at the Moment of Shutdown
When a battery suddenly changes from a moderate SOC to 0%, one of the first questions should be: What was the lowest individual cell voltage immediately before shutdown?
If all 16 cells declined together and remained reasonably balanced, SOC calibration becomes a stronger possibility. If one cell dropped far below the others, that cell may be limiting the complete pack. For example, if most cells remain near one voltage while a single cell rapidly approaches the BMS low-voltage threshold, the percentage display is not the primary issue. The real problem is cell-level imbalance or abnormal capacity.
High UPS Load Can Push One Cell Below the Limit
A battery may appear stable under light load but shut down when UPS load increases. Imagine the battery is supplying 30A and all cell voltages look normal. The customer starts additional equipment and battery current rises to 120A. Internal voltage drop increases.
The weakest cell may now fall below the BMS protection threshold even though its resting voltage looked acceptable only seconds earlier. The BMS stops discharge. The UPS shuts down. After the current disappears, the cell voltage rebounds. The customer then checks the battery and sees apparently normal voltage again. This is why data must be recorded while the fault occurs, not after the system has stopped.
Voltage Sag Does Not Mean the Energy Vanished
Suppose a cell has an open-circuit voltage that looks healthy, but its internal resistance is higher than the other cells. Under heavy current, voltage drop is approximately related to: Voltage Drop = Current × Resistance
As current increases, the abnormal cell experiences greater sag. Once current stops, the voltage rises again. The remaining chemical energy may still exist, but the cell cannot deliver it at the required power without crossing the protection threshold. This is an important difference between energy capacity and power capability.
The UPS Itself Can Cause an Apparent 0% Event
Sometimes the battery BMS does not actually change to 0%. Instead, communication between the battery and UPS or inverter disappears when the battery enters protection. The UPS can no longer receive SOC data and substitutes: 0% or Battery Empty as a default value.
In this case, the displayed 0% is an indication that communication or battery output has been lost, not necessarily the BMS’s true last SOC calculation. Compare the battery’s own screen or BMS software with the UPS display.
CAN/RS485 Communication Can Create Different SOC Numbers
A battery may show 35% on its local LCD while the inverter shows 20%. If communication fails entirely, the inverter might suddenly show 0%. The battery itself may still retain its original SOC value. Before diagnosing the cells, determine exactly which device displayed the sudden drop.
Was it:
- Battery LCD?
- Bluetooth application?
- Master BMS?
- UPS screen?
- Inverter monitoring platform?
This distinction can dramatically change the troubleshooting direction.
Incorrect Battery Capacity in the BMS Can Distort SOC
The BMS needs to know the battery’s nominal capacity for coulomb counting. If a 314Ah battery is incorrectly configured internally as 280Ah, or if the capacity parameter does not reflect the real cell configuration, SOC calculation can become inaccurate.
Likewise, if a replacement BMS is installed without entering the correct capacity, the percentage display may behave strangely. This issue is more relevant after BMS replacement, firmware configuration or custom battery production than with an untouched factory battery. Battery capacity parameters should not be changed casually by end users.
Current Sensor Offset Can Slowly Accumulate Error
A BMS measures battery current using a shunt or Hall-effect sensor. If the sensor has a small zero-current offset, the BMS might think a small charge or discharge current is flowing even when the battery is idle.
A 0.2A error seems insignificant. But over 24 hours: 0.2A × 24h = 4.8Ah
Over many days, SOC estimation can drift substantially. This is one reason BMS current calibration matters. If the battery shows current when everything is genuinely disconnected, the measurement system may need manufacturer evaluation.
Standby Loads Can Also Be Real
Not every gradual SOC loss is measurement error. The BMS, LCD, Bluetooth, Wi-Fi modules, contactors and connected inverter can consume small amounts of power continuously. A customer who thinks the battery is “doing nothing” may actually have several watts of continuous parasitic consumption.
Over days or weeks, this becomes meaningful. However, standby consumption normally causes gradual SOC reduction rather than a sudden 37% to 0% jump. A sudden jump still suggests recalibration, protection or communication behavior.
Example: SOC Drift Rather Than Capacity Loss
Consider a 51.2V 100Ah battery that has spent several months operating between approximately 30% and 80% SOC. The BMS shows 38% during a UPS outage. Cell voltages are relatively balanced, but the pack reaches the lower voltage region sooner than the BMS expected.
SOC rapidly corrects to 5%, then 0%. A controlled manufacturer-approved charge cycle later restores normal SOC tracking. This pattern points toward SOC synchronization rather than immediate evidence of severe cell degradation.
Example: One Cell Is Limiting the Battery
Now consider another 51.2V battery. At 40% displayed SOC, most cells remain around a similar voltage but one cell is significantly lower. Under a 100A UPS load, that cell rapidly reaches the BMS undervoltage threshold.
The battery disconnects and SOC becomes 0%. After the load is removed, the weak cell recovers somewhat. Repeating SOC calibration will not fix the underlying problem. The cell group requires further technical evaluation.
Example: Battery Is Too Small for the UPS Load
A third customer uses one 51.2V 100Ah battery on a high-power UPS. At light load, the battery behaves normally. During a real outage, DC current becomes very high. Voltage drops quickly and the BMS shuts down.
The customer interprets this as an SOC issue because the display showed 35% before shutdown. The real issue is that the battery bank has insufficient power capability for the UPS. Adding correctly designed parallel modules or selecting a higher-power battery configuration may be required.
How Dealers Should Diagnose a 37% → 0% Complaint
Ask the customer to provide data from the final few minutes before shutdown:
| Data | Why It Matters |
|---|---|
| BMS SOC | Shows displayed estimate |
| Battery current | Identifies load stress |
| Pack voltage | Shows overall battery response |
| Lowest cell voltage | Identifies limiting cell |
| Highest cell voltage | Shows cell spread |
| Cell delta | Detects imbalance |
| BMS alarm | Shows shutdown reason |
| UPS load in kW | Allows current plausibility check |
| Battery temperature | Identifies temperature effect |
If possible, obtain a BMS log rather than only screenshots taken after the outage. The event timestamp is extremely valuable.
Do Not Start with a Full Warranty Replacement
A sudden SOC drop is alarming, but replacing the battery before collecting data can be unnecessary. If the cause is an inaccurate SOC estimate, the replacement battery could eventually show similar behavior under the same operating pattern.
If the cause is excessive UPS current or a high cutoff setting, changing the battery alone may not solve the installation. The correct sequence is: identify the shutdown condition → determine root cause → decide whether the battery is defective. This approach reduces unnecessary warranty cost for dealers and importers.
When Is Capacity Testing Appropriate?
If SOC calibration and system settings appear normal but the customer still experiences premature shutdown, a controlled capacity or energy test can help. The test should use documented conditions including starting SOC, discharge current or power, temperature and cutoff.
Compare actual delivered Ah or kWh with the product specification. For UPS applications, it can also be useful to perform a separate higher-power load test because a battery can show adequate low-rate capacity but poor high-current performance. Capacity and power are related but not identical.
Do Not Deep-Discharge Repeatedly Just to “Reset the Percentage”
End users sometimes read online that lithium batteries should be drained to 0% to recalibrate SOC. Repeatedly forcing the battery into BMS low-voltage protection is not a good general maintenance method.
If calibration is required, follow the battery manufacturer’s specific procedure. The objective is to provide the BMS with valid reference conditions, not to stress the cells unnecessarily. For a UPS system, hard BMS shutdown can also interrupt critical loads.
UPS Dealers Should Explain SOC Uncertainty During Commissioning
When replacing lead-acid with lithium, technicians should explain that the BMS SOC percentage is an estimate and may require time to synchronize after installation.
Customers should also understand that the UPS itself may display a different percentage. This is especially important if the UPS does not support direct lithium BMS communication. Clear expectations reduce the tendency to interpret every percentage change as immediate capacity loss.
Battery Distributors Should Ask for Logs Before Accepting “Capacity Failure”
A customer saying: “Battery went from 40% to 0%, so capacity is only 60%.” is not enough evidence. The battery may have delivered much more than 60% of its energy before the event, depending on starting calibration. Request actual discharged Ah or kWh, cell data and shutdown reason. This protects the customer from unnecessary replacement and the distributor from incorrect warranty decisions.
When Should You Suspect a Real Battery Problem?
A genuine cell or pack issue becomes more likely when several conditions occur together: one cell repeatedly reaches low voltage much earlier than the others, cell-voltage difference becomes large under modest load, controlled capacity is below specification, or the same shutdown occurs after SOC has been properly synchronized.
A single percentage jump without supporting electrical evidence is not enough. Always evaluate the physical battery data.
Conclusion
When a LiFePO4 battery shows 30–40% SOC and suddenly falls to 0%, the missing percentage has usually not disappeared instantly.
The most common explanations include SOC estimation drift, low-cell protection, high-load voltage sag, communication loss, incorrect BMS capacity parameters or insufficient battery power capability for the UPS.
The key diagnostic value is not the percentage immediately before shutdown. It is the combination of battery current, individual cell voltage, BMS alarm and actual UPS load.
HIZN supplies LiFePO4 batteries for UPS, telecom and stationary energy storage with intelligent BMS monitoring and multiple current/capacity configurations.
If your customer’s battery suddenly changes from a moderate SOC to 0%, send us the battery model, UPS load, BMS log, lowest cell voltage and current at shutdown. We can help determine whether the issue is SOC calibration, cell behavior or system power matching.